Observare's cloud-managed uptime and port monitors are fantastic for anything facing the public internet, but they can only reach what Observare's own servers can reach. They can't see a PostgreSQL instance on a private VLAN, a RabbitMQ cluster inside a Docker network, a staging environment behind a WireGuard tunnel, or a Redis bound to 127.0.0.1 on a single host.
That's what agent-executed uptime and port monitors are for. They're the same check, with the same failure semantics and the same alerting, but executed by your Linux agent from inside the network where the target actually lives.
When to reach for an internal check
- Private HTTP services. Internal APIs, admin panels, health endpoints on services that don't face the public internet.
- Databases. Postgres, MySQL, Redis, Mongo — a TCP port check on the listen port proves the daemon is actually accepting connections.
- Message brokers. RabbitMQ, NATS, Kafka — the management UI might face the internet but the broker's own port rarely does.
- Localhost services. Anything bound to
127.0.0.1that the cloud workers physically cannot reach. - Services inside a Docker network. The agent runs on the host, but it can reach any Docker network the host can route to.
- Anything behind a VPN or firewall. The agent is already inside — it can see what you can see.
What the checker does
Internal uptime and internal port checks use the same check logic as the cloud-executed versions, just running inside the agent process instead of on Observare's servers.
Internal uptime
An HTTP GET against the monitor's URL, with the configured timeout applied. The User-Agent is observare-linux-agent/<version>. Redirects are followed. The response body is drained and discarded — content doesn't matter for an uptime check.
Success requires the response status code to match the monitor's expected status (default 200). Any other status, a TLS handshake failure, a DNS lookup failure, a connection refused, or a request that exceeds the timeout all count as a failure, classified into the same error types the cloud checker uses:
| Error type | When |
|---|---|
timeout |
Request exceeded the configured timeout |
dns_failure |
DNS lookup for the host failed |
connection_refused |
Target refused the TCP connection |
ssl_error |
TLS handshake failed, cert invalid, or chain broken |
unexpected_status |
Got a response but the status code didn't match |
unreachable |
Host or network unreachable |
invalid_request |
The URL couldn't be parsed |
See uptime monitoring for the full reference on what each error means.
Internal port
A TCP connect or a UDP probe against hostname:port. TCP is a three-way handshake against the port and counts as a success if the socket opens. UDP sends a datagram and treats a read timeout as a success (UDP doesn't acknowledge, and the absence of an ICMP "port unreachable" is the best signal you're going to get).
See port monitoring for the full reference on TCP vs UDP semantics and the failure types.
Creating an internal check
Internal checks are created from the agent host, via the agent's interactive config menu:
observare configSelect Add uptime monitor or Add port monitor and fill in:
Uptime:
- Friendly name — 1–100 characters.
- URL — the HTTP or HTTPS URL to check (e.g.
http://10.0.0.5:8080/health,https://internal-api.corp.lan/status). - Check interval — 5, 10, or 15 minutes.
- Expected status code — defaults to 200.
- Timeout — 5–120 seconds. Default 30.
- Alert channels.
Port:
- Friendly name — 1–100 characters.
- Host — hostname or IP (up to 253 characters).
- Port — 1–65535.
- Protocol — TCP or UDP, defaults to TCP.
- Check interval — 5, 10, or 15 minutes.
- Timeout — 5–120 seconds. Default 10.
- Alert channels.
The agent uploads the new monitor and starts checking it within 30 seconds. The first result appears on the relevant list page in the web UI a few seconds later.
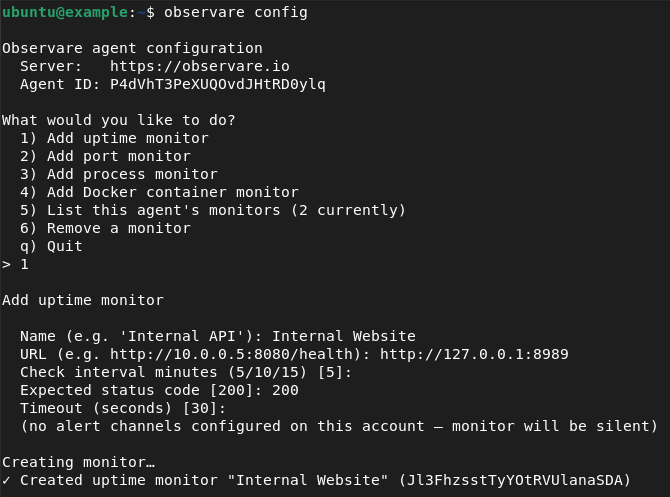
Creating an internal uptime monitor
The video below walks through adding an internal uptime monitor from the agent CLI and shows the monitor appearing on the Uptime page in the Observare panel.
Creating an internal port monitor
The same flow for an internal port monitor — created from the agent CLI using observare config, then visible on the Port monitoring page in the panel within seconds.
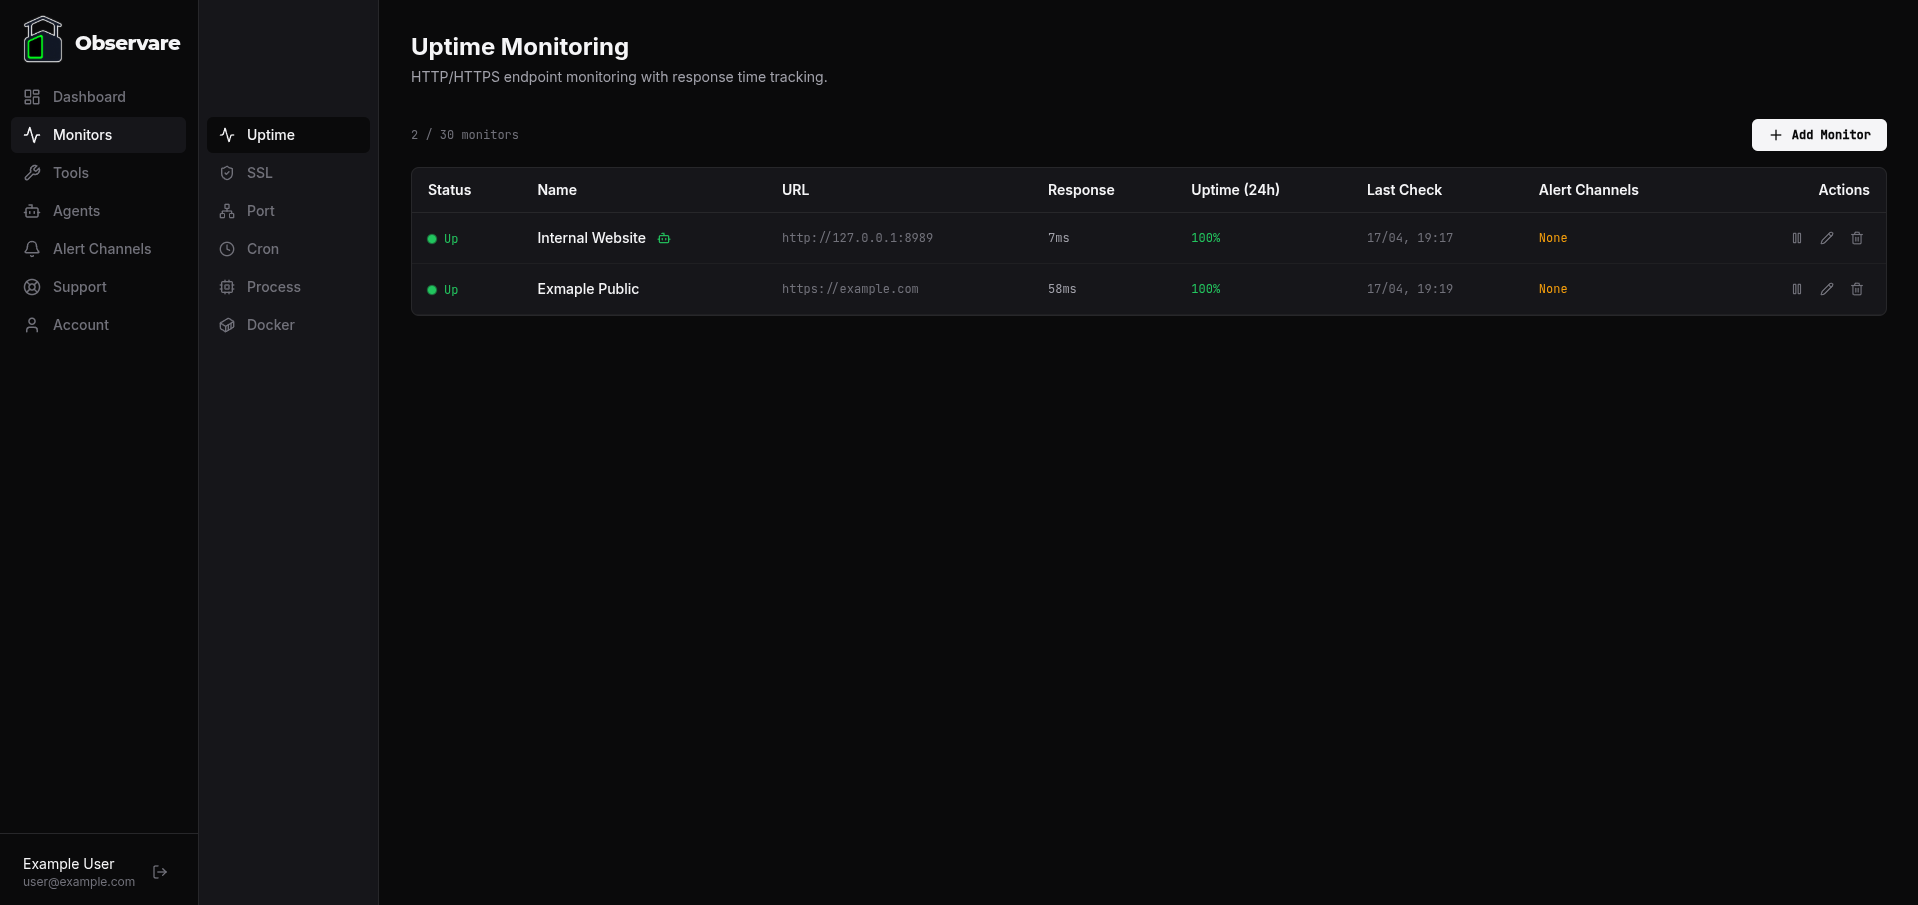
How internal monitors appear in the web UI
Internal monitors are not segregated into a separate list in the web UI — they sit alongside cloud-executed monitors of the same type. An internal uptime check shows up on the Uptime monitoring page next to the public uptime checks; an internal port check shows up on the Port monitoring page next to the public port checks.
You can tell them apart at a glance by the agent badge next to the monitor name:
- A green robot icon means the monitor is executed by an agent that's currently online.
- A red robot icon means the monitor is executed by an agent that's currently offline — the monitor may still be reporting from its own cached state, but new results aren't landing.
- No icon means the monitor is cloud-executed (the default when you create a monitor from the web UI).
Hover over the icon to see which agent is running the check.
What you still get
Agent-executed monitors are functionally identical to cloud-executed ones on every axis that matters for alerting and incident history:
- Local recheck on failure. Same 30-second wait-and-re-check cycle the agent uses for process and docker monitors — a first failure doesn't fire an alert until the recheck confirms it.
- Incidents and recovery alerts. Opened on confirmed failure, closed with a recovery alert and total downtime on the next success.
- Flapping detection. Two or more incidents in a rolling 30-minute window marks the monitor as flapping and swaps the down alert for a flapping alert.
- Pause and resume from the web UI. The agent picks up the state change on its next config-pull (within 30 seconds) and stops checking.
- Per-monitor alert channels. Pick which of your channels get notified from the monitor's detail page — same UI as any other monitor type.
- Detail page — uptime percentages over 24 hours, 7 days, and 30 days, response-time chart for uptime monitors, paginated check history, and the incident log.
How it behaves when the agent goes offline
If the agent itself stops reporting for more than 2 minutes, Observare marks the agent as offline and sends a single agent-offline alert to whichever channels you've attached to the agent on the Agents page — not to the individual monitors.
The individual monitors attached to the agent stay in whatever state they were last reported as. Their status does not automatically flip to "down" just because the agent is offline — we don't know that the target is down, we only know that nobody's checking it. Agent-recovery alerts fire on the same channel when the agent reports again.
The single-alert-on-agent-offline design is deliberate: the alternative is a burst of simultaneous per-monitor down alerts every time the agent reboots, which is the classic noisy-monitoring anti-pattern.
Account limits
Internal uptime monitors count against the same 30-monitor uptime cap as cloud-executed uptime monitors. Internal port monitors count against the same 30-monitor port cap. The agent itself costs nothing against those caps — you can run as many agents as your account allows (5 by default), and each agent can execute up to 30 internal uptime monitors and 30 internal port monitors alongside the other caps.
Check history older than 90 days is automatically deleted. Incidents are kept indefinitely.
What's next
- Uptime monitoring — full reference for HTTP/HTTPS check semantics.
- Port monitoring — full reference for TCP and UDP check semantics.
- Process monitoring — for "is this daemon alive?" checks that don't have an HTTP endpoint or an open port.
- Docker monitoring — for containerised services.
- Setting up alert channels — for where alerts from internal checks actually land.