Give your users a live view of your service health — without building anything yourself. Observare's status pages are public-facing, branded to match your identity, and update automatically from the monitors you already have running.
Where status pages live
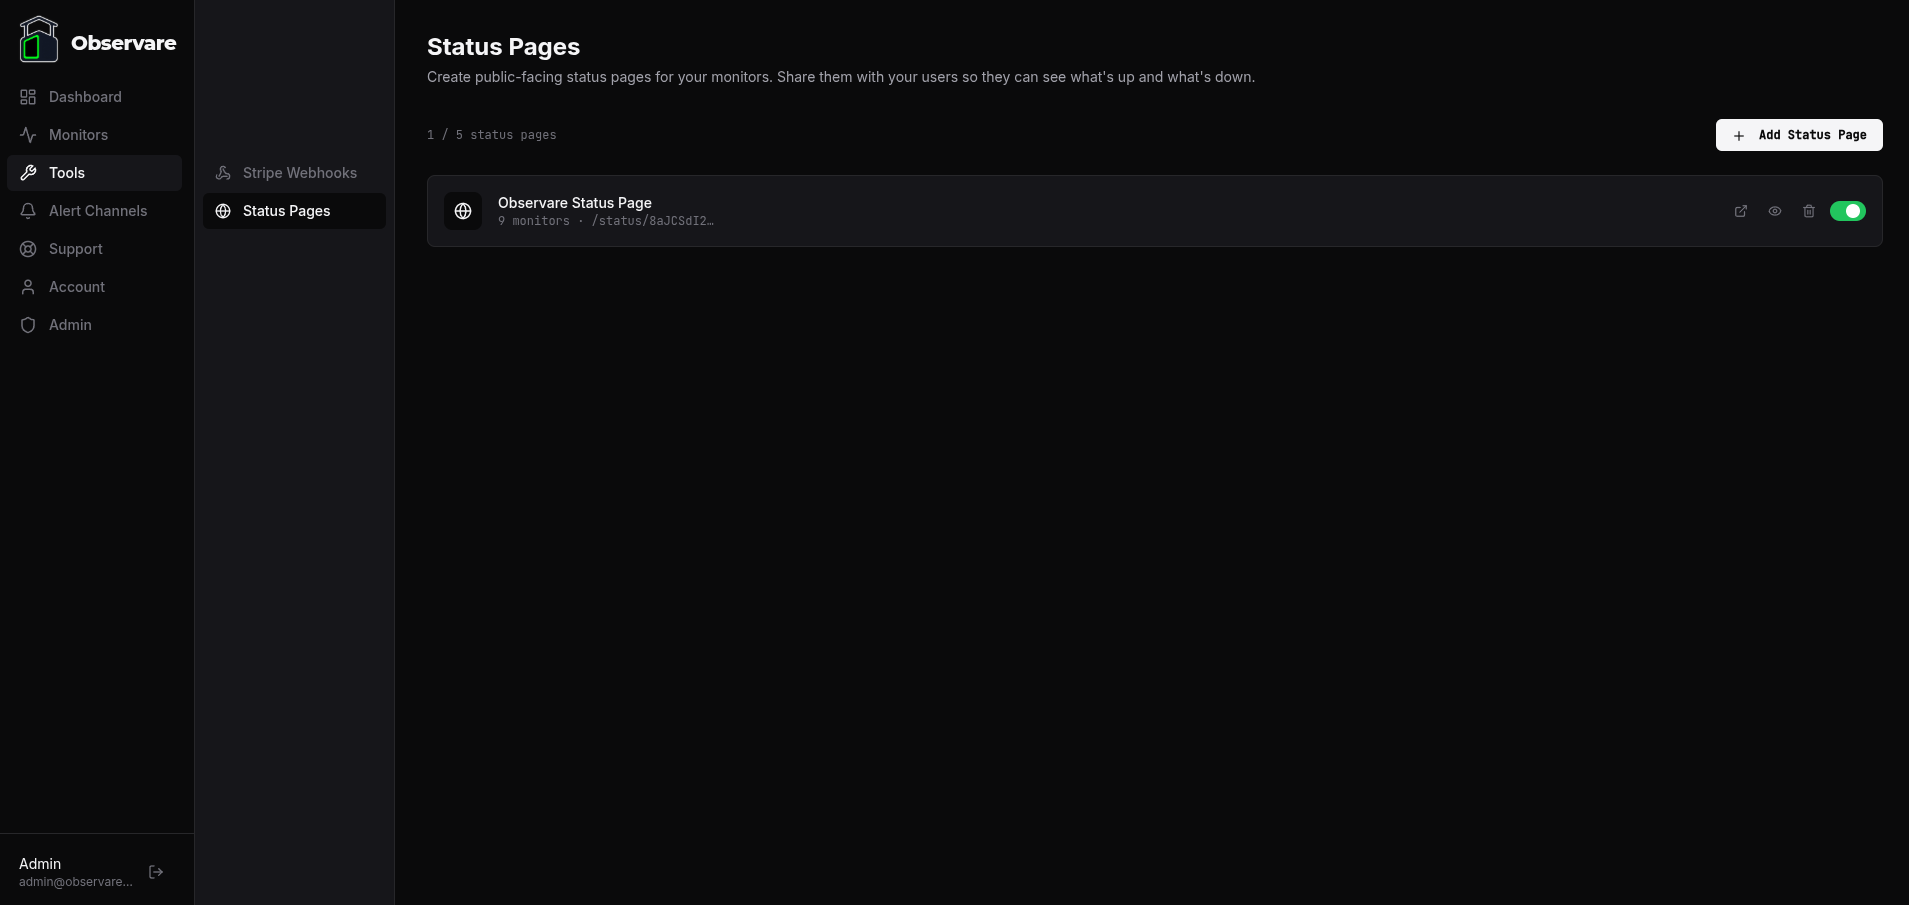
Status pages are managed under Tools → Status Pages in the sidebar. Each account can create up to 5 status pages, each with its own URL, branding, and monitor selection.
Creating a status page
Click Add Status Page. Give it a name (internal, for your reference) and a page title (shown publicly at the top of the page). Click Create Status Page and you'll be taken to the settings screen.
Your status page is live immediately at a unique URL:
https://observare.io/status/<token>Copy the URL from the setup card at the top of the settings page and share it with your users, link it from your footer, or embed it in your documentation.
Branding
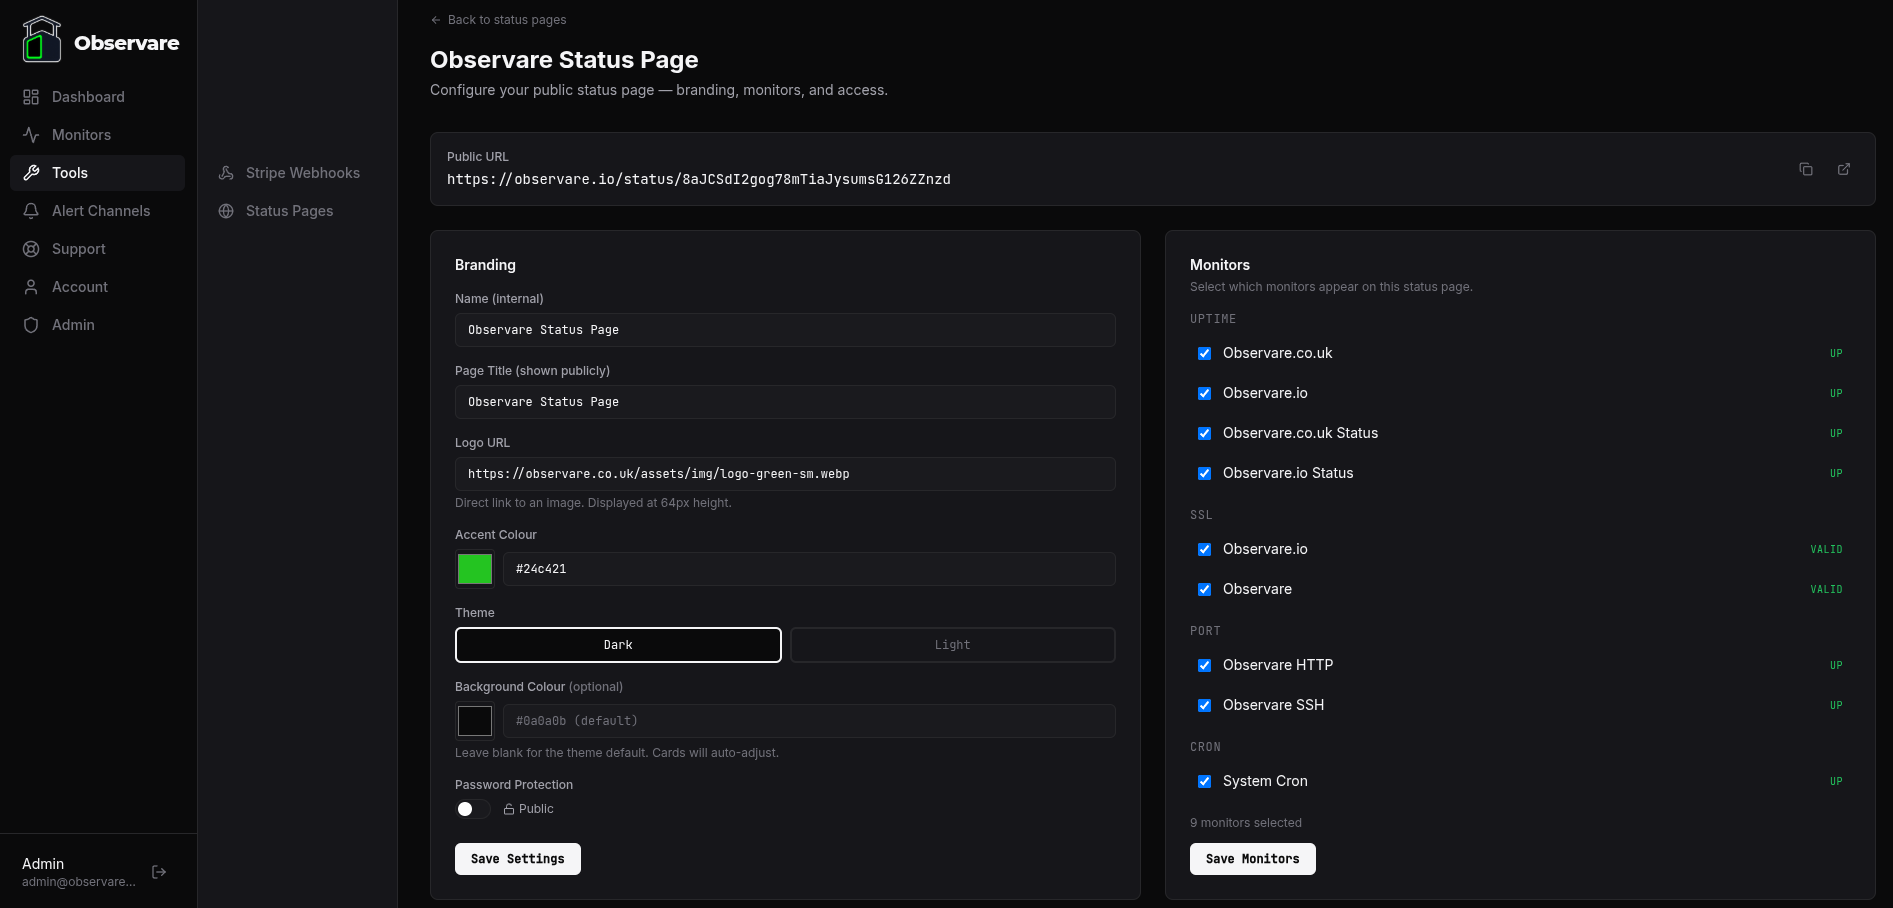
Each status page has its own visual identity:
- Page Title — the heading shown to visitors at the top of the page.
- Logo URL — a direct link to your logo image (PNG, SVG, etc). Displayed at 64px height in the page header. Leave blank for no logo.
- Accent Colour — the colour used for "operational" status dots and the overall status banner. Pick your brand colour using the colour picker or paste a hex code.
- Theme — choose between Dark (black/grey, matches the Observare aesthetic) or Light (white/grey, cleaner for brands that use light backgrounds).
- Background Colour — optionally override the theme's default background with any hex colour. Card backgrounds auto-adjust to maintain contrast.
All branding changes take effect immediately on the public page — no deploy, no cache wait.
Selecting monitors
The right-hand panel on the settings page shows all your monitors grouped by type: Uptime, SSL, Port, and Cron. Tick the ones you want to appear on this status page.
Only selected monitors are shown publicly. Monitors you don't select stay private — your visitors won't know they exist. This lets you keep internal monitors (staging servers, dev endpoints, internal cron jobs) out of the public view while showing production services.
Click Save Monitors after making changes. The public page groups monitors under type headings — Uptime, SSL Certificates, Port Monitors, Cron Heartbeats — so visitors can scan by category.
What the public page shows
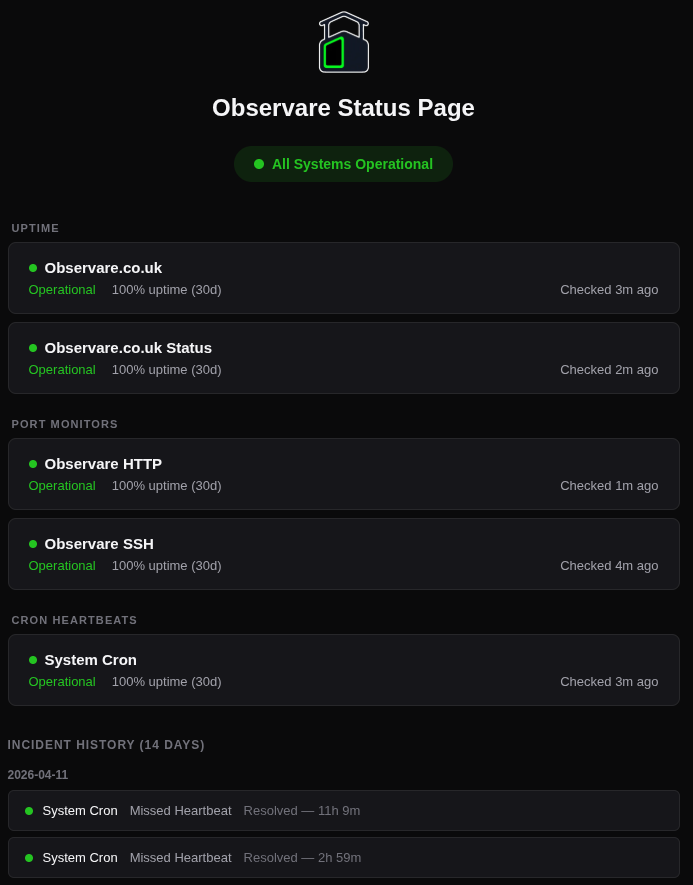
Your status page displays three things:
-
Overall status banner — a single badge at the top:
- All Systems Operational (green) — every monitor is up/valid
- Degraded Performance (amber) — at least one monitor has a warning but none are down
- System Outage (red) — at least one monitor is down or invalid
- Status Unknown (grey) — all monitors are paused or pending
-
Monitor cards — one card per selected monitor, grouped by type. Each card shows:
- Monitor name
- Current status with a coloured dot
- 30-day uptime percentage
- When it was last checked
-
Incident history (14 days) — a timeline of recent incidents grouped by date. Each entry shows the monitor name, what happened (Down, Missed Heartbeat, Job Failed), when it started, when it was resolved, and the total downtime. If there are no incidents, visitors see "No incidents in the last 14 days."
The page auto-refreshes every 30 seconds via the browser's cache headers — visitors don't need to manually reload to see changes.
Password protection
If you want to restrict access, toggle Password Protection on in the branding settings and set a password. Visitors will see a password gate instead of the status page. Once they enter the correct password, a cookie is set for 24 hours so they don't have to re-enter it on every visit.
JSON API
Every public status page (without password protection) also has a JSON API:
GET https://observare.io/api/public/status/<token>Returns the same data the HTML page renders — overall status, monitor list with uptime percentages, and incident history — in a structured JSON format. Useful for embedding status data in your own dashboard, Slack bot, or monitoring pipeline.
Enabling and disabling
Each status page has an enable/disable toggle on the list page. Disabled pages return a 404 to visitors — the URL still exists but nothing is served. Useful for temporarily hiding a status page without deleting it.
Limits
- 5 status pages per account
- 50 monitors per status page
- No limit on the number of visitors to your status page
- Public pages are rate-limited to 60 requests per minute per token to prevent abuse
What's next
- Setting up alert channels — make sure you're getting notified when monitors go down, not just showing it on the status page.
- FAQ & troubleshooting — common questions and fixes.