Uptime monitoring checks that an HTTP or HTTPS endpoint is reachable and returning the status code you expect. It's the most common monitor type and usually the first one people add. This page describes exactly what the uptime checker does today.
What the checker does
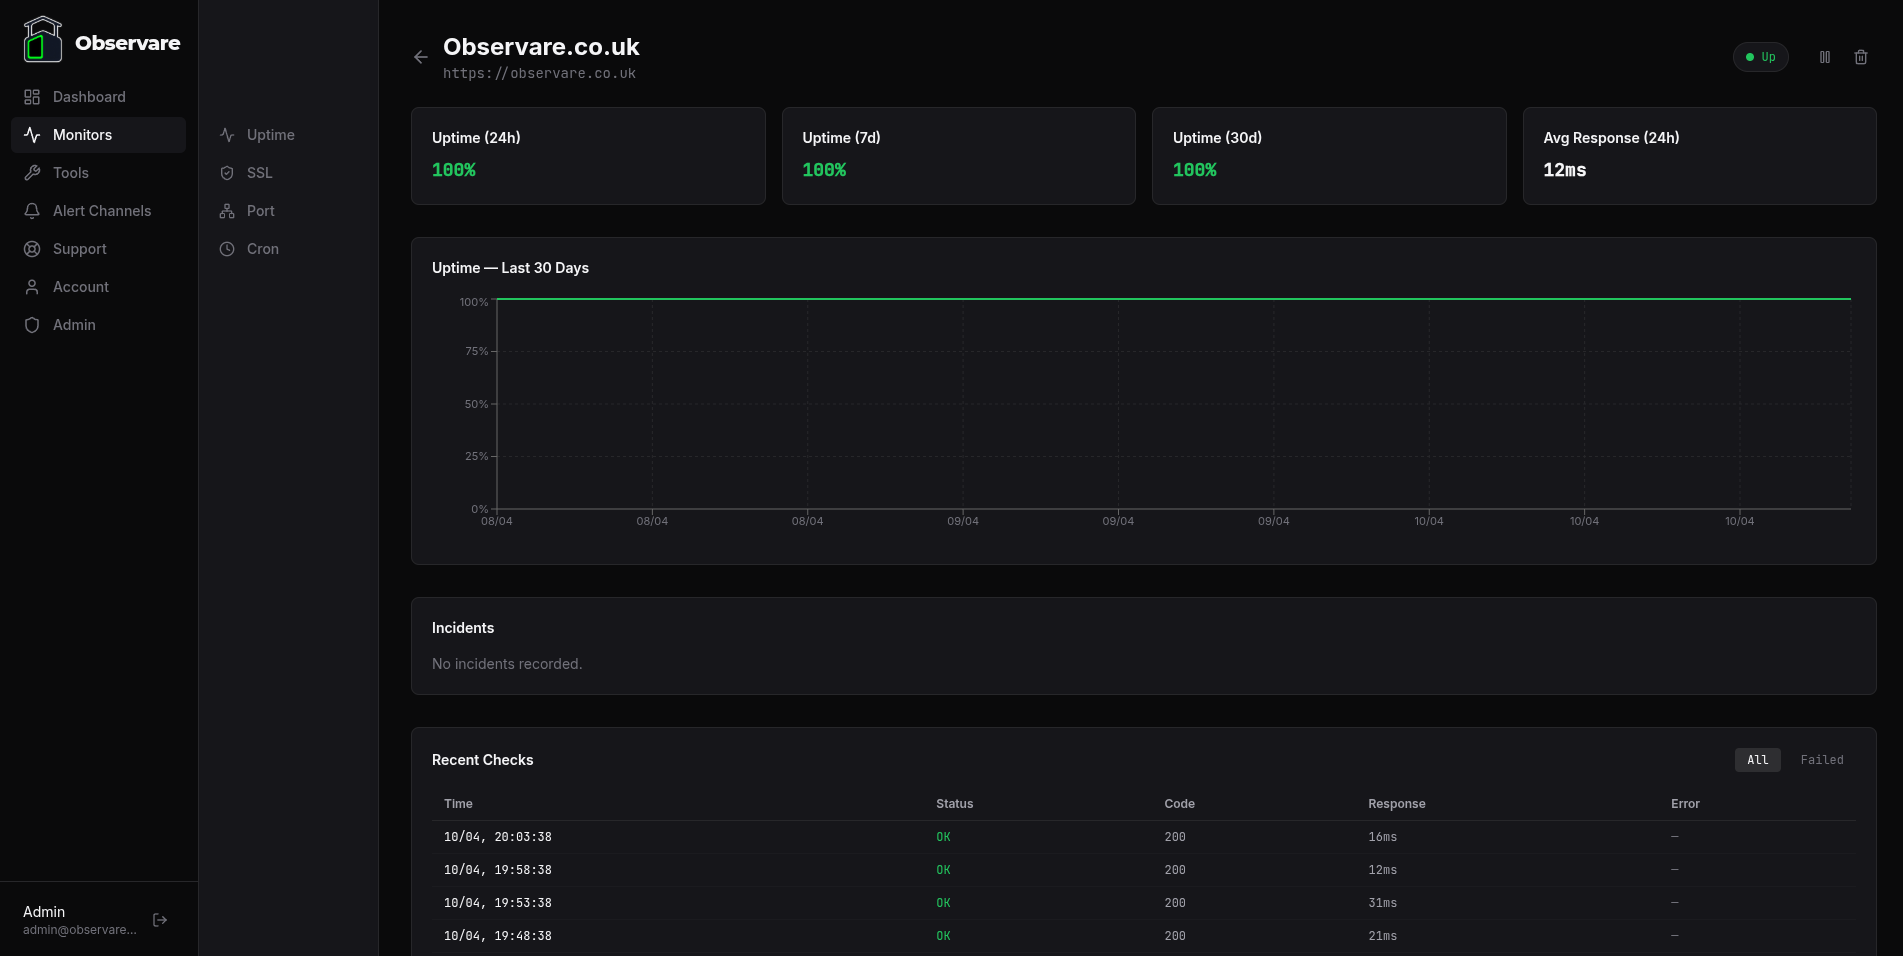
For every uptime monitor, Observare periodically sends a GET request to the URL you configured and records:
- The HTTP status code it received
- The total response time in milliseconds
- Whether the request succeeded (status code matches what you expected)
- If it failed, the category and message of the failure
Observare identifies itself with the user-agent string Observare/1.0 (https://observare.io) so you can allowlist it in your WAF or analytics if needed.
Redirects are followed automatically (up to the default Node fetch limit). The checker only issues GET — other HTTP methods, custom headers, and request bodies are not supported.
Creating a monitor
Go to Monitors → Uptime → Add monitor and fill in:
- Name — a human-friendly label, 1–100 characters.
- URL — the full URL you want to check, up to 2048 characters. Must be a valid URL.
- Check interval — how often Observare should probe. 5, 10, or 15 minutes.
- Expected status code — the exact status code Observare should consider a pass. Defaults to
200. Any other response (including301,302,204, or a5xx) counts as a failure unless you change this value. - Timeout — how long to wait for a response before giving up. 5–120 seconds, default 30.
- Alert channels — pick which of your configured alert channels should be notified when this monitor fails.
Save and Observare will start checking the monitor on the schedule. The first check runs within a minute or two.
204 No Content, set the expected status to 204 — leaving it at the default 200 will treat every check as a failure.
How a failure is confirmed
Observare doesn't fire an alert the first time a check fails. When the first failure happens, it schedules a second check 30 seconds later against the same URL. Only if that second check also fails does the monitor get marked down and an alert go out.
This catches the single biggest source of false positives: a transient network hiccup between the Observare checker and your server. If the retry passes, nothing is alerted and the monitor stays in an up state.
Failure categories
When a check fails, Observare categorises the failure so you know what kind of problem it is:
| Error type | When it fires |
|---|---|
timeout |
The request didn't complete within the configured timeout |
dns_failure |
DNS lookup for the hostname failed (e.g. ENOTFOUND) |
connection_refused |
The server refused the TCP connection (ECONNREFUSED) |
ssl_error |
TLS handshake failed — expired cert, bad chain, or other cert errors |
unexpected_status |
The server responded but with a status code that doesn't match the expected value |
The exact category and the raw error message are shown on the monitor's check history and included in the outgoing alert so you can start debugging without opening anything else.
Incidents and recovery
When a failure is confirmed, Observare opens an incident for the monitor: a record of when it started being down, when it recovered, and the total downtime in seconds.
- The monitor's status flips to down.
- A Monitor Down alert is sent to every alert channel you've assigned.
- The monitor continues to be checked on its normal interval; subsequent failures while already down do not trigger more alerts.
- When the next successful check lands, the incident is resolved, downtime is calculated, and a Monitor Recovered alert is sent with the total duration.
Flapping detection
If a monitor opens two or more incidents within a 30-minute window, Observare marks the latest incident as flapping and sends a Flapping alert instead of another plain Down alert. This is your signal that something isn't a clean outage — the service is bouncing up and down, and the root cause is usually different from "the server is just down".
Flapping alerts replace the standard down alert for that specific incident so the channels aren't hammered repeatedly during a noisy period.
Pausing a monitor
If you're deploying or running maintenance and don't want alerts, open the monitor and click Pause. A paused monitor stops being checked entirely — no requests go out, no checks recorded, no alerts fired. Click Resume to bring it back.
Response times and history
Every check records its response time in milliseconds. These are kept for 90 days and then automatically deleted to keep the database from growing unbounded. The monitor detail page shows the recent history as a chart plus the raw check log.
There's no response-time alerting yet — Observare doesn't fire a warning just because a response got slow. Only hard failures (timeout, DNS, connection refused, SSL error, wrong status) trigger alerts today.
Account limits
Each account can have up to 30 uptime monitors. If you try to add a 31st, the dashboard will refuse until you delete one. The 30-monitor cap applies per type — so you can run 30 uptime monitors and 30 SSL monitors and 30 port monitors and 30 cron heartbeats on the same account, up to 120 monitors in total.
Common issues
- Every check fails with
unexpected_status— your endpoint is probably returning something other than the status code you set. Check the raw check log for the actual code and update the monitor. - DNS failures from behind Cloudflare or similar — Observare resolves DNS at the source of the check. If your DNS is misconfigured or intermittent, you'll see
dns_failureerrors even though the site works in a browser that has cached DNS. - SSL errors on an otherwise healthy site — the leaf cert might be fine but the intermediate chain isn't being served. Pair with an SSL monitor to catch this before it blocks uptime checks.
- Aggressive WAF or rate limiter — allowlist the
Observare/1.0user-agent or contact support for the current checker IPs.
What's next
- SSL certificate monitoring — don't wait for an uptime alert to find out your cert expired.
- Port monitoring — for non-HTTP services.
- Setting up alert channels — make sure down alerts actually reach you.