Cron heartbeat monitoring answers a question that most monitoring tools ignore: is this scheduled job actually running?
An uptime monitor proves your web server is up. An SSL monitor proves your cert is valid. Neither of them has any idea that your nightly database backup stopped running three weeks ago because a permissions change broke the cron job. By the time you notice, you have no recent backup to restore.
Heartbeat monitoring closes that gap.
How it works (push model)
Cron heartbeats are a push model, not a poll. You give Observare a cron expression describing when the job is supposed to run, and Observare gives you a unique ping URL. Your job pings that URL every time it runs. If Observare doesn't receive a ping within the expected window plus a grace period, it opens an incident and alerts you.
This is a dead-man's switch: the absence of a signal is the alarm.
*/15 * * * * /usr/local/bin/run-backup.sh && curl -fsS https://observare.io/ping/<token>If run-backup.sh fails, the && short-circuits the curl, no ping arrives, and Observare alerts you after the grace period. If cron itself stops running (crontab wiped, daemon crashed, machine decommissioned) you get the same alert for the same reason: no heartbeat.
Creating a heartbeat monitor
Go to Monitors → Cron → Add monitor and fill in:
- Name — a human-friendly label, e.g.
nightly-db-backup. - Schedule — pick a preset from the dropdown or enter your own standard 5-field cron expression. The presets cover the common cases:
- Every 5 minutes
- Every 15 minutes
- Every 30 minutes
- Every hour
- Every 6 hours
- Every day at midnight
- Every Monday at midnight
- First of every month
- Timezone — an IANA timezone identifier (e.g.
Europe/London,America/New_York,Asia/Tokyo). Defaults to UTC. See the big note below about why this matters. - Grace period — how long Observare should wait after the expected ping time before treating it as missed. Between 1 minute and 24 hours. Default is 10 minutes.
- Alert channels — which of your configured alert channels should receive the alerts.
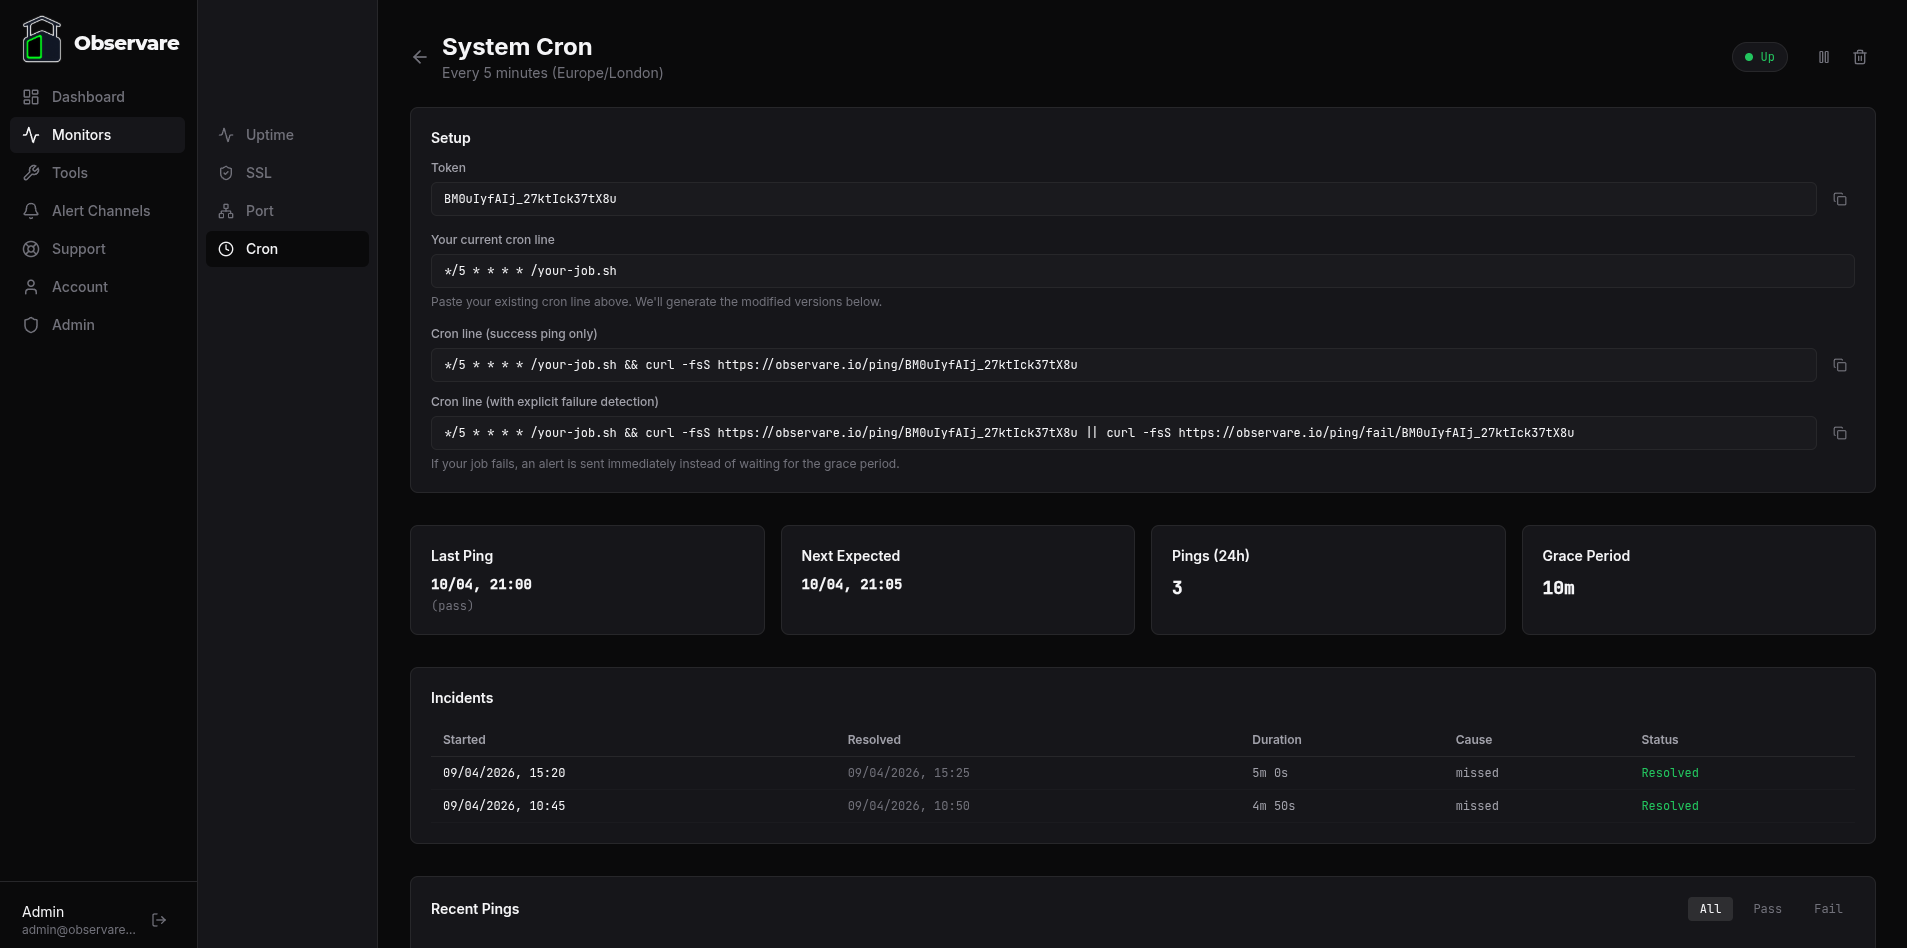
Save the monitor and open it from the list to see the Setup card. This card is where Observare hands you everything you need to wire the monitor into your crontab. It contains:
- Token — a 24-character random string that Observare generates for this monitor. Copy this out if you're building the URL yourself, or just use the generated cron lines below.
- Your current cron line — a text box where you paste the line from your crontab that runs the job. For example:
*/15 * * * * /usr/local/bin/backup.sh- Cron line (success ping only) — auto-generated from whatever you pasted above, appending
&& curl -fsS https://observare.io/ping/<token>. Copy this version into your crontab and your job will ping Observare after every successful run. - Cron line (with explicit failure detection) — also auto-generated, of the form
<your job> && curl -fsS <pass URL> || curl -fsS <fail URL>. Copy this version if you want Observare to alert immediately on a job failure instead of waiting for the next scheduled window to expire.
Both generated lines stay blank until you paste something into the "your current cron line" input — there's nothing to copy until Observare knows what command to wrap.
curl -fsS https://observare.io/ping/... parts). If you want the raw URLs for use outside a crontab — a systemd timer, a GitHub Action, a Kubernetes CronJob — copy the Token and construct them yourself, substituting {token} with the value from the Setup card:
https://observare.io/ping/{token} for success
https://observare.io/ping/fail/{token} for failure
0 2 * * * with timezone = Europe/London means "2:00 AM London time" — which is 01:00 UTC in winter and 01:00 UTC in summer (because the cron runs at 2am local in both). Get the timezone wrong and every expected ping will be off by an hour and you'll get spurious missed alerts.
Ping endpoints
Your ping URL looks like:
https://observare.io/ping/<token>There are three endpoints you can hit:
| Endpoint | Purpose |
|---|---|
/ping/<token> |
Success ping (the lazy default — both GET and POST work) |
/ping/pass/<token> |
Explicit success ping — alias for the bare form |
/ping/fail/<token> |
Explicit failure ping |
All endpoints accept both GET and POST. Any 2xx response from Observare means the ping was recorded; specifically, Observare replies with 200 OK and the body OK.
Reporting success
A bare ping to the token URL counts as "the job ran successfully":
curl -fsS https://observare.io/ping/<token>Reporting failure
Append /fail/ to the URL to tell Observare the job explicitly failed:
if ! /usr/local/bin/run-backup.sh; then
  curl -fsS https://observare.io/ping/fail/<token>
  exit 1
fi
curl -fsS https://observare.io/ping/<token>
A /fail ping opens an incident immediately with cause failed — Observare doesn't wait for the next scheduled window to alert you.
Rate limiting
Each token is rate-limited to 60 pings per minute. Exceed that and Observare returns 429 Too Many Requests. This is high enough that legitimate jobs will never hit it, but it stops a runaway script from flooding the endpoint.
What happens when a ping arrives
Each successful ping updates the monitor with the current time, recomputes the next expected ping time from the cron expression and timezone, and flips the status to up. If the monitor was down (from either a missed or a failed alert), Observare resolves the open incident, calculates the downtime, and sends a Recovery alert.
Each fail ping records the failure, flips the status to down, opens a failed incident, and fires a Failed alert.
Pings to a paused monitor are accepted silently (you get a 200) but not recorded. Pings to a token that doesn't exist get a 404.
What happens when a ping doesn't arrive
A worker process runs every 30 seconds and looks for any enabled monitor whose next_expected_at + grace_period has passed and that isn't already down. When it finds one, it:
- Flips the status to down
- Opens an incident with cause
missed - Sends a Missed alert
The worker specifically skips monitors in the pending state — i.e. ones that have never received their first ping. This is intentional: newly-created monitors don't fire "missed" alerts before you've had a chance to install the cron line on your machine. The first ping moves the monitor out of pending, and from then on missed detection is active.
Monitor status
A cron heartbeat monitor's status is one of:
| Status | Meaning |
|---|---|
pending |
Monitor was just created — no ping has been received yet. Missed detection is disabled until the first ping arrives. |
up |
Last ping was a success and we haven't crossed the next expected time plus grace period |
down |
Either a fail ping was received or a scheduled ping didn't arrive within the grace period |
paused |
Monitor is paused — no worker checks, pings are accepted but not recorded |
The four alert types
Cron heartbeats can send four different alerts:
- Missed (
[MISSED]) — fired when the worker detects a scheduled ping never arrived within its grace period. - Failed (
[FAILED]) — fired when an explicit/failping is received. - Recovered (
[RECOVERED]) — fired when a previously-down monitor receives a successful ping and the incident is resolved. - Flapping (
[FLAPPING]) — fired when a monitor opens two or more incidents within a 30-minute window, replacing that specific incident's missed/failed alert.
Every alert lists the monitor name, the schedule, the timezone, and the incident's start time so you can triage without opening the dashboard.
Flapping detection
If a cron monitor opens two or more incidents within a 30-minute window, Observare marks the latest incident as flapping and sends a Flapping alert instead of another plain missed/failed alert. This catches jobs that are toggling between success and failure rapidly — usually a symptom of a flaky dependency rather than a clean outage.
Example: nightly backup
You have a script at /usr/local/bin/backup.sh that runs at 2am London time. You want to be paged if it stops running or if it fails.
- Create a cron heartbeat monitor with schedule
0 2 * * *, timezoneEurope/London, and grace period 30 minutes (because the backup can sometimes take 20+ minutes). - Copy the ping URL.
- Edit your crontab:
0 2 * * * /usr/local/bin/backup.sh && curl -fsS https://observare.io/ping/<token> || curl -fsS https://observare.io/ping/fail/<token>This sends a pass-ping if the backup exits 0 or a fail-ping if it exits non-zero. Observare gets a signal either way, and "no signal at all" (the third case) will fire a missed alert 30 minutes after 2 AM London time.
Pausing a monitor
Open the monitor and click Pause. A paused monitor stops being checked by the worker, so no missed alerts fire. Pings to the URL are accepted silently but not recorded. Click Resume to bring the monitor back — the next expected time is recalculated from the cron expression the moment you resume, so the worker can start detecting missed pings again.
This is exactly what you want during maintenance or while decommissioning a job: stop the alerts, leave the URL working so your cron doesn't error, come back to it later.
Ping history and retention
Every ping is stored with a timestamp, type (pass/fail), source IP, and the user-agent string of whatever sent it. The monitor detail page shows the recent history.
Ping records older than 90 days are automatically deleted.
Works with anything that can make an HTTP request
The push model works for every shape of scheduled job:
- Traditional unix cron
- systemd timers
- Kubernetes CronJobs
- GitHub Actions schedules
- AWS / GCP / Azure scheduled functions
- Ad-hoc
atjobs - A manual script you run from your laptop
If it can do curl https://... at the end, it can ping Observare.
Account limits
Each account can have up to 30 cron heartbeat monitors. The cap is independent of your other monitor types — 30 cron monitors alongside 30 uptime, 30 SSL, and 30 port monitors on the same account.
What's next
- Setting up alert channels — so your backup job failing at 2 AM actually wakes you up.
- Uptime monitoring — for the web-facing side of the same system.