Port monitoring is a low-level network check that answers one question: is something listening on this host and port? It's the right tool for services that aren't HTTP — SSH, SMTP, IMAP, databases, game servers, VPN endpoints, custom protocols, anything where "can I open a socket to it?" is the question that matters.
What the checker does
For every port monitor, Observare opens a connection to hostname:port on the schedule you configured. Depending on the protocol you picked, it does one of two things:
TCP checks
Observare opens a raw TCP socket to the host and port. If the three-way handshake completes — SYN → SYN/ACK → ACK — the check is counted as a success and the round-trip time is recorded. The socket is then closed immediately without sending any application-level data.
Observare does not read a banner, speak the protocol, or verify the service behind the port. All it confirms is that something is accepting TCP connections on that port. For most operational questions ("is my SSH daemon running?", "is Postgres listening?", "has my firewall broken?") that's exactly the right answer.
UDP checks
UDP is connectionless, so there's no handshake to complete. Instead, Observare sends a single empty datagram to the host and port, then waits up to the configured timeout. The check is counted as a success if either:
- A response datagram arrives, or
- The timeout expires with no response and no ICMP "port unreachable" message came back.
It's counted as a failure if the OS receives an ICMP unreachable (ECONNREFUSED), a DNS lookup failure (ENOTFOUND), or a host-unreachable error (EHOSTUNREACH / ENETUNREACH).
Creating a monitor
Go to Monitors → Port → Add monitor and fill in:
- Name — a human-friendly label, 1–100 characters.
- Host — hostname or IP address, up to 253 characters.
- Port — the port number, 1–65535.
- Protocol —
TCPorUDP. Defaults to TCP. - Check interval — 5, 10, or 15 minutes.
- Timeout — how long to wait for the connection (or the absence of a UDP rejection) before giving up. 5–120 seconds. Default is 10 seconds.
- Alert channels — which of your configured alert channels should be notified when the monitor fails.
Save and the first check runs within a couple of minutes.
Common examples
SSH
Host:      server.example.com
Port:      22
Protocol:  TCP
A passing TCP check on port 22 means something is accepting connections. If you've ever seen a rogue listener bind to port 22 you already know a successful TCP check isn't proof the service is sshd specifically — but in practice this catches the most common failures: the host being unreachable, the firewall dropping inbound, or the daemon having crashed.
SMTP
Host:      mail.example.com
Port:      25  (or 465 / 587)
Protocol:  TCP
PostgreSQL
Host:      db.example.com
Port:      5432
Protocol:  TCP
A TCP check is all you can reliably do from the outside without credentials. It catches the biggest failure mode: the Postgres process has crashed and nothing is listening on 5432.
OpenVPN (UDP)
Host:      vpn.example.com
Port:      1194
Protocol:  UDP
UDP is approximate, but if your firewall or VPN server drops the packet entirely you'll see a success. You get a real failure only if the OS gets an ICMP unreachable back.
How a failure is confirmed
Observare doesn't fire an alert on the first failed check. When the first failure happens, it schedules a second check against the same host/port 30 seconds later. Only if that second check also fails does the monitor get marked down and an alert go out.
This catches transient packet loss and network hiccups that would otherwise produce noisy false-positive alerts.
Failure categories
When a check fails, the failure is classified into one of these types:
| Error type | When it fires |
|---|---|
connection_refused |
TCP: server sent RST on the SYN (ECONNREFUSED). UDP: ICMP port unreachable. |
dns_failure |
DNS lookup for the hostname failed (ENOTFOUND). |
unreachable |
OS reported the host or network as unreachable (EHOSTUNREACH / ENETUNREACH). |
timeout |
No response within the configured timeout window. |
The raw error message is recorded and included in the outgoing alert so you can triage without opening the dashboard.
Incidents and recovery
When a failure is confirmed, Observare opens an incident for the monitor: a record of when it started being down, when it recovered, and the total downtime in seconds.
- The monitor's status flips to down.
- A Port Down alert is sent to every alert channel you've assigned.
- The monitor continues to be checked on its normal interval; subsequent failures while already down do not trigger more alerts.
- When the next successful check lands, the incident is resolved, downtime is calculated, and a Port Recovery alert is sent with the total duration.
Flapping detection
If a port monitor opens two or more incidents within a 30-minute window, Observare marks the latest incident as flapping and sends a Flapping alert instead of another plain down alert. This is your signal that the port isn't cleanly down — it's bouncing up and down, which usually points at load, a bad health check, or a restarting process.
Flapping alerts replace the down alert for that specific incident so your channels aren't hammered repeatedly during a noisy period.
Pausing a monitor
Open a port monitor and click Pause. A paused monitor stops being checked entirely — no packets go out, no checks are recorded. Click Resume to bring it back; the status resets to pending until the next check completes. Useful if you're taking a box out of rotation for maintenance and don't want down alerts for an hour.
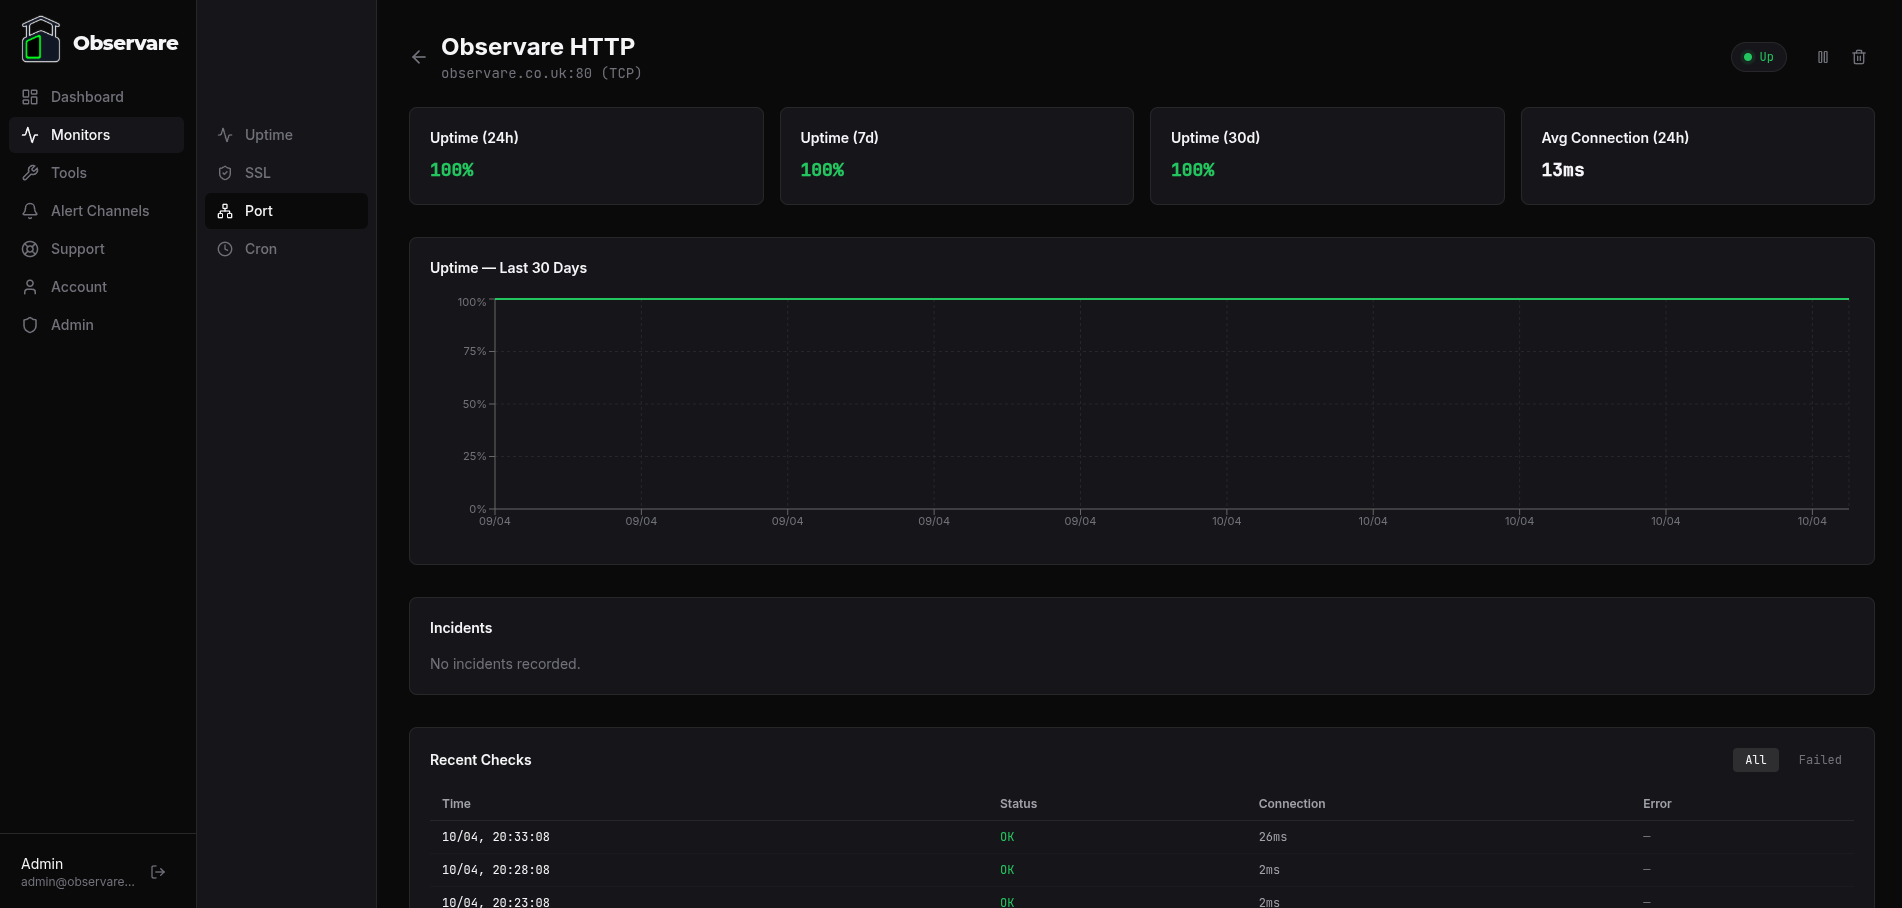
Response times and history
Every check records its response time in milliseconds. For TCP this is the round-trip to a successful handshake; for UDP it's the time to either a response datagram or the timeout. The monitor detail page shows the recent history as a chart plus the raw check log.
Check history older than 90 days is automatically deleted to keep the database from growing unbounded.
Account limits
Each account can have up to 30 port monitors. The cap is independent of your uptime, SSL and cron monitors — 30 port monitors runs alongside 30 of each other type on the same account.
When to reach for a different monitor type
- You're checking HTTP or HTTPS. Use an uptime monitor instead — you'll get status code validation, response time tracking, and SSL error detection for free.
- You care about the TLS certificate on the port. Use an SSL monitor, which actually reads and validates the cert instead of just proving a socket opens.
- You're watching a scheduled job, not a listener. Use a cron heartbeat monitor.
What's next
- Uptime monitoring — for HTTP and HTTPS endpoints.
- SSL certificate monitoring — pair with a port monitor on mail or LDAP servers.
- Setting up alert channels — make sure down alerts actually reach you.