Docker monitoring answers one question: is a named container currently running on this host? It's the right tool when the thing you care about is packaged as a container — a database, a message broker, a microservice, a self-hosted app — and you want a simple "is it up?" signal that understands the difference between a container that's running, one that's exited, and one that's paused.
What the checker does
On every scheduled tick, the agent opens a short-lived HTTP connection to the Docker daemon's Unix socket at /var/run/docker.sock and calls the GET /containers/json?all=true endpoint. That returns every container on the host along with its current state. The agent looks for a container whose name matches the monitor's configured container_name exactly — the leading / Docker adds to container names internally is stripped before comparison.
- Running — a container with that name exists and its state is
running. - Not Running — the container doesn't exist, is in any state other than
running, or the Docker daemon can't be reached.
The check uses a 5-second timeout against the local socket. Anything slower means the daemon is wedged, which is worth knowing about in its own right.
/var/run/docker.sock it needs to be in the docker group. The installer deliberately does not add it for you — adding a user to the docker group is effectively granting root on the host, and that's your call to make. If docker monitors are failing with docker_unavailable, this is almost certainly why:
sudo usermod -aG docker $USER
sudo systemctl restart observare-agent
Creating a monitor
Docker monitors are created from the Linux agent running on the target host. From that host:
observare configPick Add Docker container monitor from the interactive menu, then fill in the friendly name, the exact container name as shown in docker ps (without the leading slash), the check interval (5, 10, or 15 minutes), and which of your existing alert channels should be notified on failure.
Use the real container name, not the image name. If your compose file names the container app-postgres-1, that's what the agent needs — not postgres or postgres:15. Check what's actually running with docker ps --format '{{.Names}}' before configuring the monitor.
The agent uploads the new monitor to Observare and starts checking it within 30 seconds.
Viewing your Docker monitors
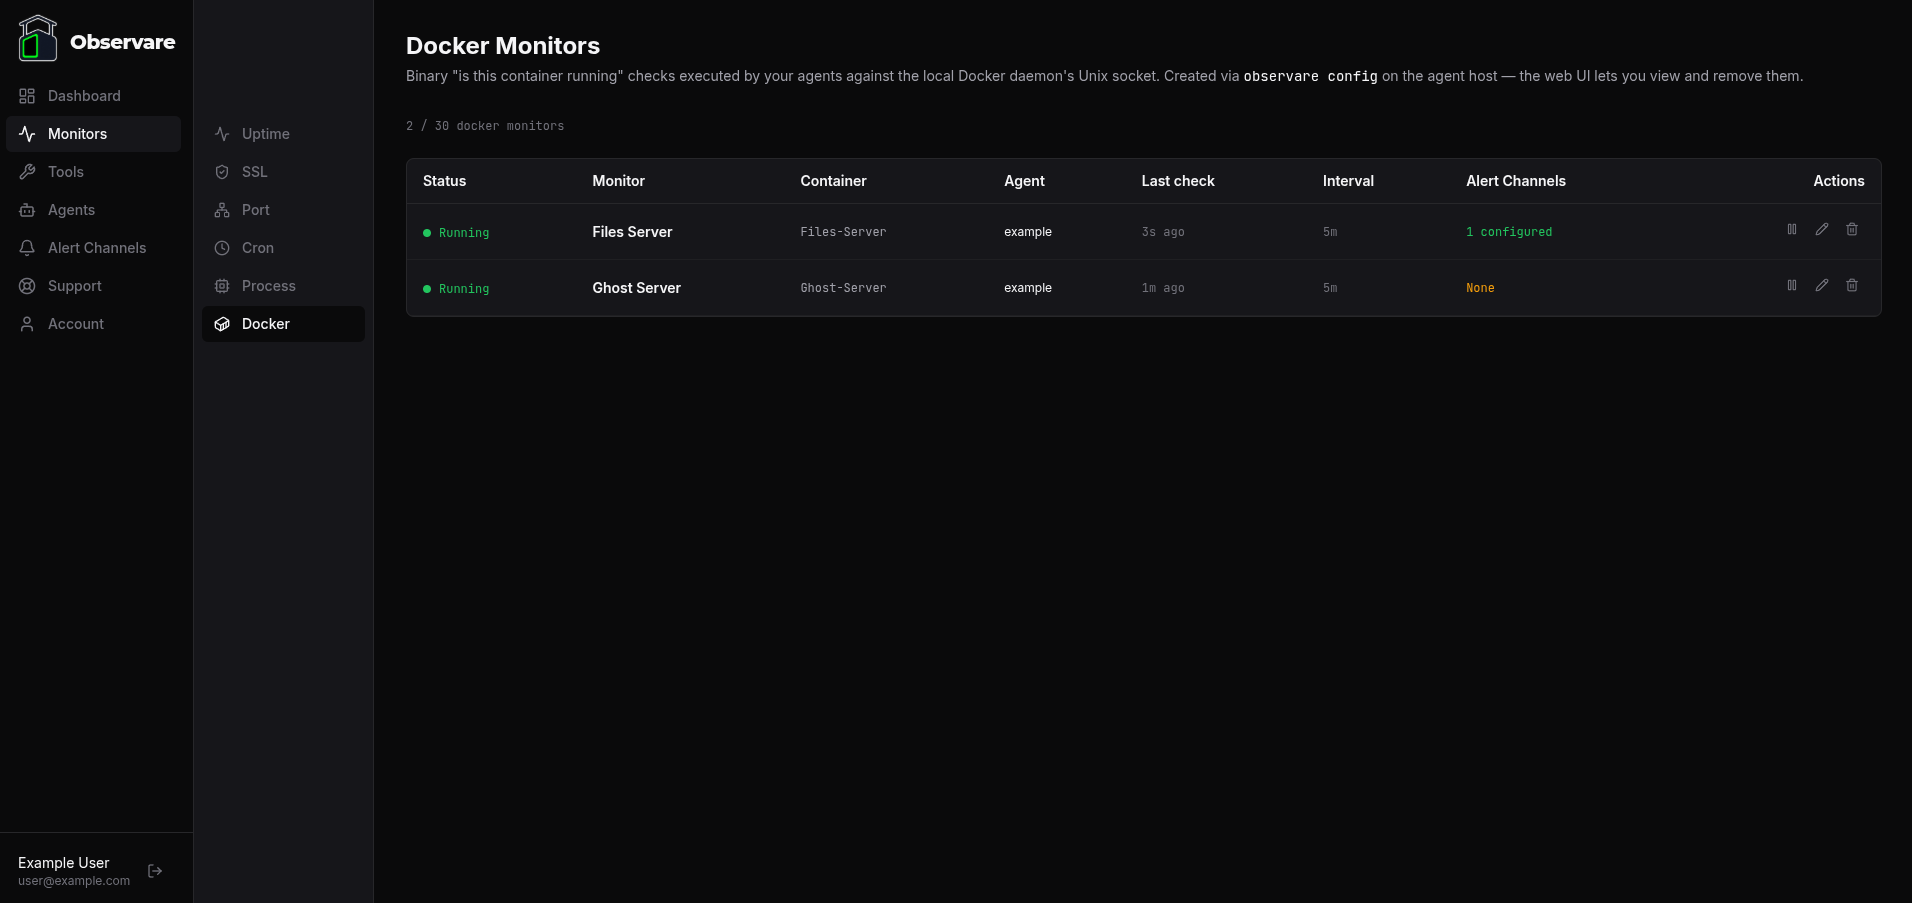
Go to Monitors → Docker in the sidebar. You get a list of every Docker monitor across every agent you've authorised, with:
- Status — Running / Not Running / Paused / Pending
- Monitor — the friendly name you picked at creation
- Container — the exact name the agent is matching against
- Agent — which host is running the check
- Last check — relative time since the last result
- Interval
- Alert channels — how many channels are attached
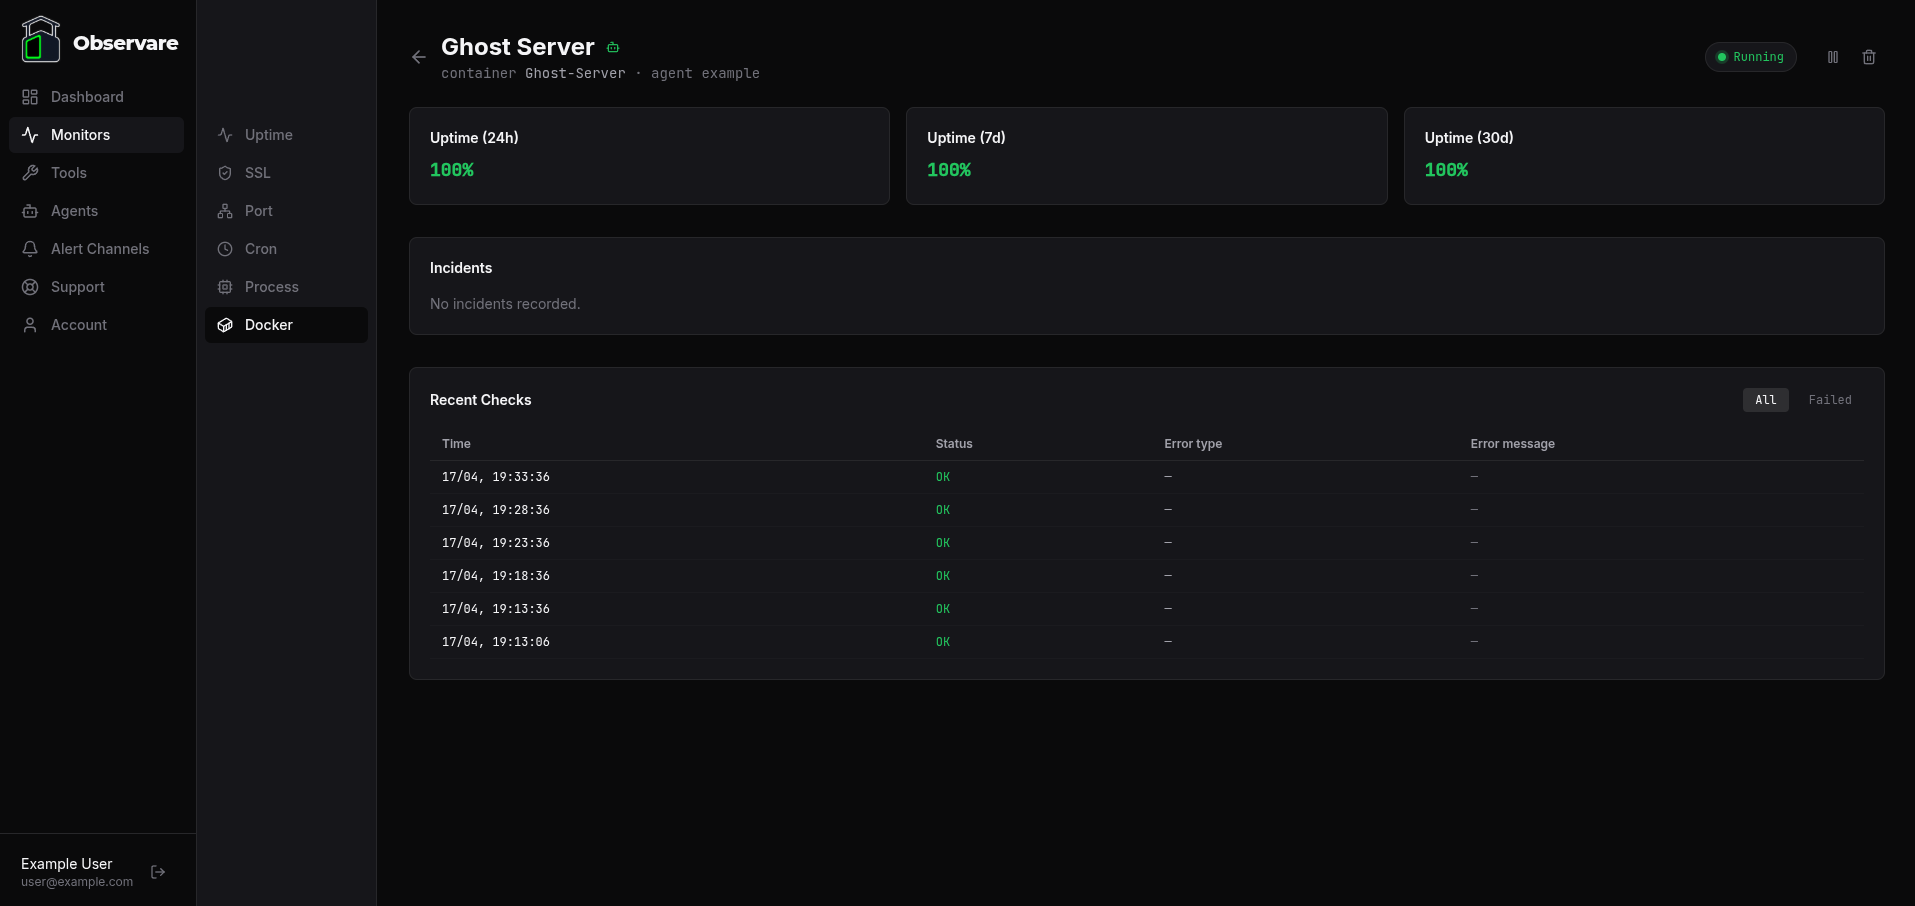
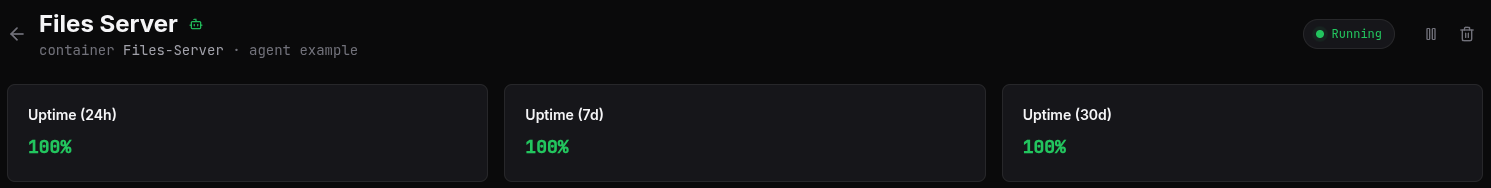
Click any row to open the monitor's detail page, which shows uptime percentages over 24 hours, 7 days, and 30 days, the current incident (if any), and a paginated history of recent checks you can filter to All or Failed.
Editing a monitor
Click the pencil icon on a row to open the edit modal. You can change the name, the check interval, and the alert channels attached to the monitor. The container name itself is part of the monitor's identity and can't be edited — if the container gets renamed, delete the monitor and recreate it from the agent CLI with the new name.
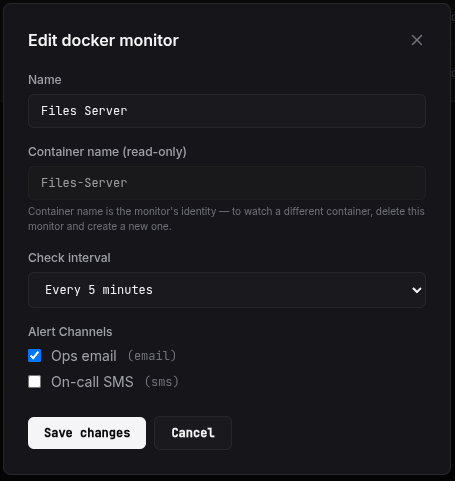
Changes are picked up by the owning agent on its next 30-second config-pull, so the new interval takes effect within 30 seconds.
Failure categories
| Error type | When it fires |
|---|---|
docker_unavailable |
The agent couldn't reach the Docker daemon at all — socket missing, permission denied, daemon down, or the agent user isn't in the docker group. |
not_found |
No container on the host has the configured name. It was renamed, removed, or never started. |
not_running |
The container exists but its state is something other than running — exited, paused, created, restarting, removing, or dead. The actual state is included in the error message. |
The agent always includes the Docker daemon's reported state in the error message, which makes the difference between "the container crashed and restarted" and "someone ran docker pause during maintenance" obvious from the alert itself.
How a failure is confirmed
The agent doesn't submit the first failed check. On any first failure it waits 30 seconds, re-runs the check, and only submits the second result. This local recheck catches containers that are briefly in restarting between exits on a bad day without firing a full down-alert.
When the server does see a down result, it treats the failure as already-confirmed and dispatches the alert immediately.
Incidents and recovery
When a failure is confirmed, Observare opens an incident for the monitor:
- The monitor's status flips to Not Running.
- A Docker Down alert is sent to every alert channel attached to the monitor.
- Subsequent failed checks do not generate new alerts while the monitor is already down.
- When the agent next sees the container as
runningagain, the incident is closed and a Docker Recovery alert is sent with the total duration.
Flapping detection
If a Docker monitor opens two or more incidents within a rolling 30-minute window, Observare marks the latest one as flapping and sends a Flapping alert instead of another plain down alert.
A flapping container is usually one of three things: a container in a crash-restart loop (check docker logs and the Docker daemon's own logs), a health check that's killing a perfectly good container, or a resource issue like OOM. The flapping alert is your signal to dig into the container directly instead of just restarting it again.
Pausing a monitor
Open a Docker monitor and click Pause. The agent picks up the pause on its next config-pull (within 30 seconds) and stops checking the container entirely. Click Resume to bring it back; the status resets to Pending until the next check lands.
Useful for planned outages — the container is down and you know it, and you don't want 20 minutes of noise.
Deleting a monitor
Click the trash icon on a row (or on the detail page header) to delete the monitor. A confirmation prompt asks you to confirm — this can't be undone. Deleting also removes every check and every incident the monitor ever recorded. The agent picks up the deletion on its next config-pull and stops checking.
Account limits
Each account can have up to 30 Docker monitors. The cap is independent of your uptime, SSL, port, cron, and process monitors — 30 Docker monitors runs alongside 30 of each other type on the same account.
Check history older than 90 days is automatically deleted. Incidents are kept indefinitely.
When to reach for a different monitor type
- The container exposes an HTTP health endpoint on the host. Use an internal uptime check against that endpoint instead, or alongside. A health endpoint catches "container is running but the app inside is stuck" failures a plain Docker check can't.
- You care that the container's port is accessible. An internal port check against the published port proves the listener is accepting connections, which is a different question from "the container is running".
- You want to watch a raw process, not a container. Use a process monitor — it reads
/procdirectly, no Docker daemon involved. - You're watching a scheduled job, not a long-running service. Use a cron heartbeat monitor.
What's next
- Process monitoring — the same "is it running?" check against a raw Linux process.
- Installing the Linux agent — how to get an agent running on a host so you can add Docker monitors to it.
- Setting up alert channels — make sure down and flapping alerts actually reach you.