Process monitoring answers one question: is a named process currently running on this host? It's the right tool for daemons that have no HTTP health endpoint and no obvious port to probe — background workers, queue consumers, long-running scripts, legacy services, anything where "has it crashed?" is the question that matters.
What the checker does
On every scheduled tick, the agent walks /proc on its host and looks for any PID whose /proc/<pid>/comm value exactly equals the monitor's configured process name. This is the same semantic as pgrep <name> without the -f flag — the kernel-recorded task name, not the full command line.
- Running — at least one matching process exists.
- Not Running — no process on the host has a matching
comm.
The check is a microsecond-scale filesystem operation, so there's no response-time measurement and no real performance cost. A process monitor is a binary "is at least one running?" check, not a worker-count check.
TASK_COMM_LEN of 16 bytes (15 characters plus a null terminator) on the kernel-recorded task name. If you run a Python script called queue_worker.py, the kernel sees it as python3, not queue_worker. Check what your process actually looks like to the kernel before setting up the monitor:
ps -eo pid,comm | grep -i <name>
Creating a monitor
Process monitors are created from the Linux agent running on the target host. From that host:
observare configPick Add process monitor from the interactive menu, then fill in the friendly name, the /proc/*/comm process name to match (maximum 15 characters), the check interval (5, 10, or 15 minutes), and which of your existing alert channels should be notified on failure.
The agent uploads the new monitor to Observare and starts checking it within 30 seconds. The first result shows up on this page a few seconds after that.
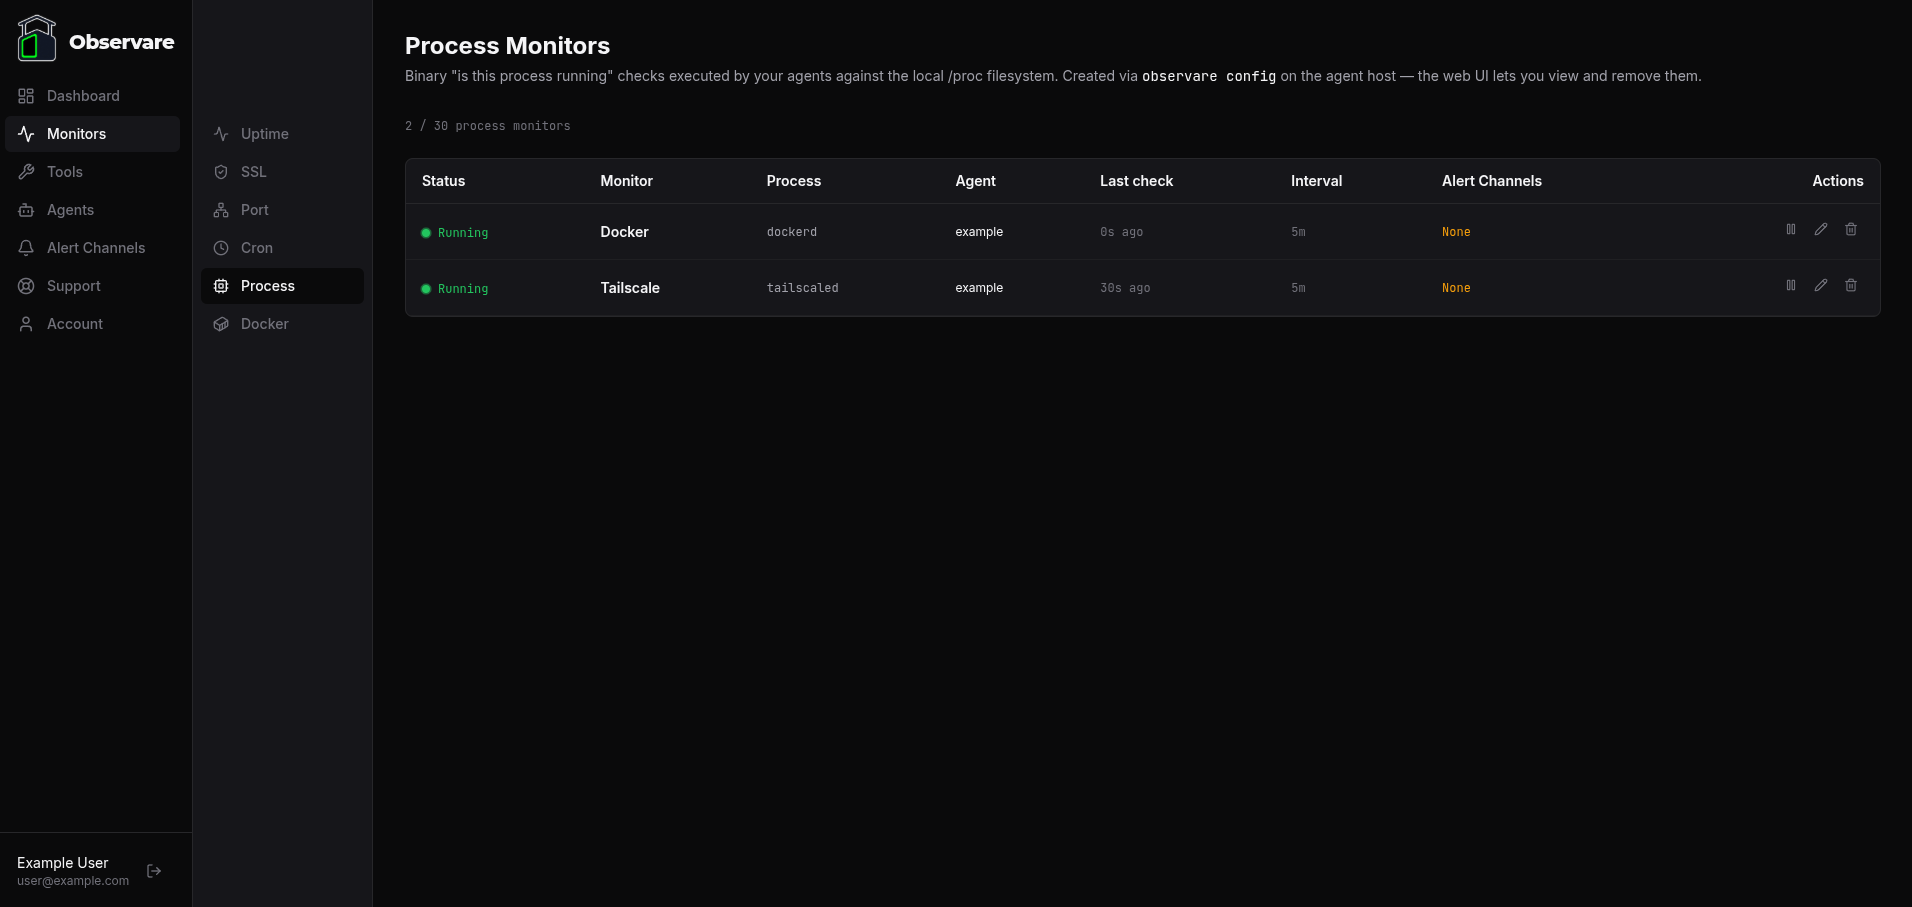
Viewing your process monitors
Go to Monitors → Process in the sidebar. You get a list of every process monitor across every agent you've authorised, with:
- Status — Running / Not Running / Paused / Pending
- Monitor — the friendly name you picked at creation
- Process — the exact
commstring the agent is matching against - Agent — which host is running the check
- Last check — relative time since the last result
- Interval — how often it's checked
- Alert channels — how many channels are attached
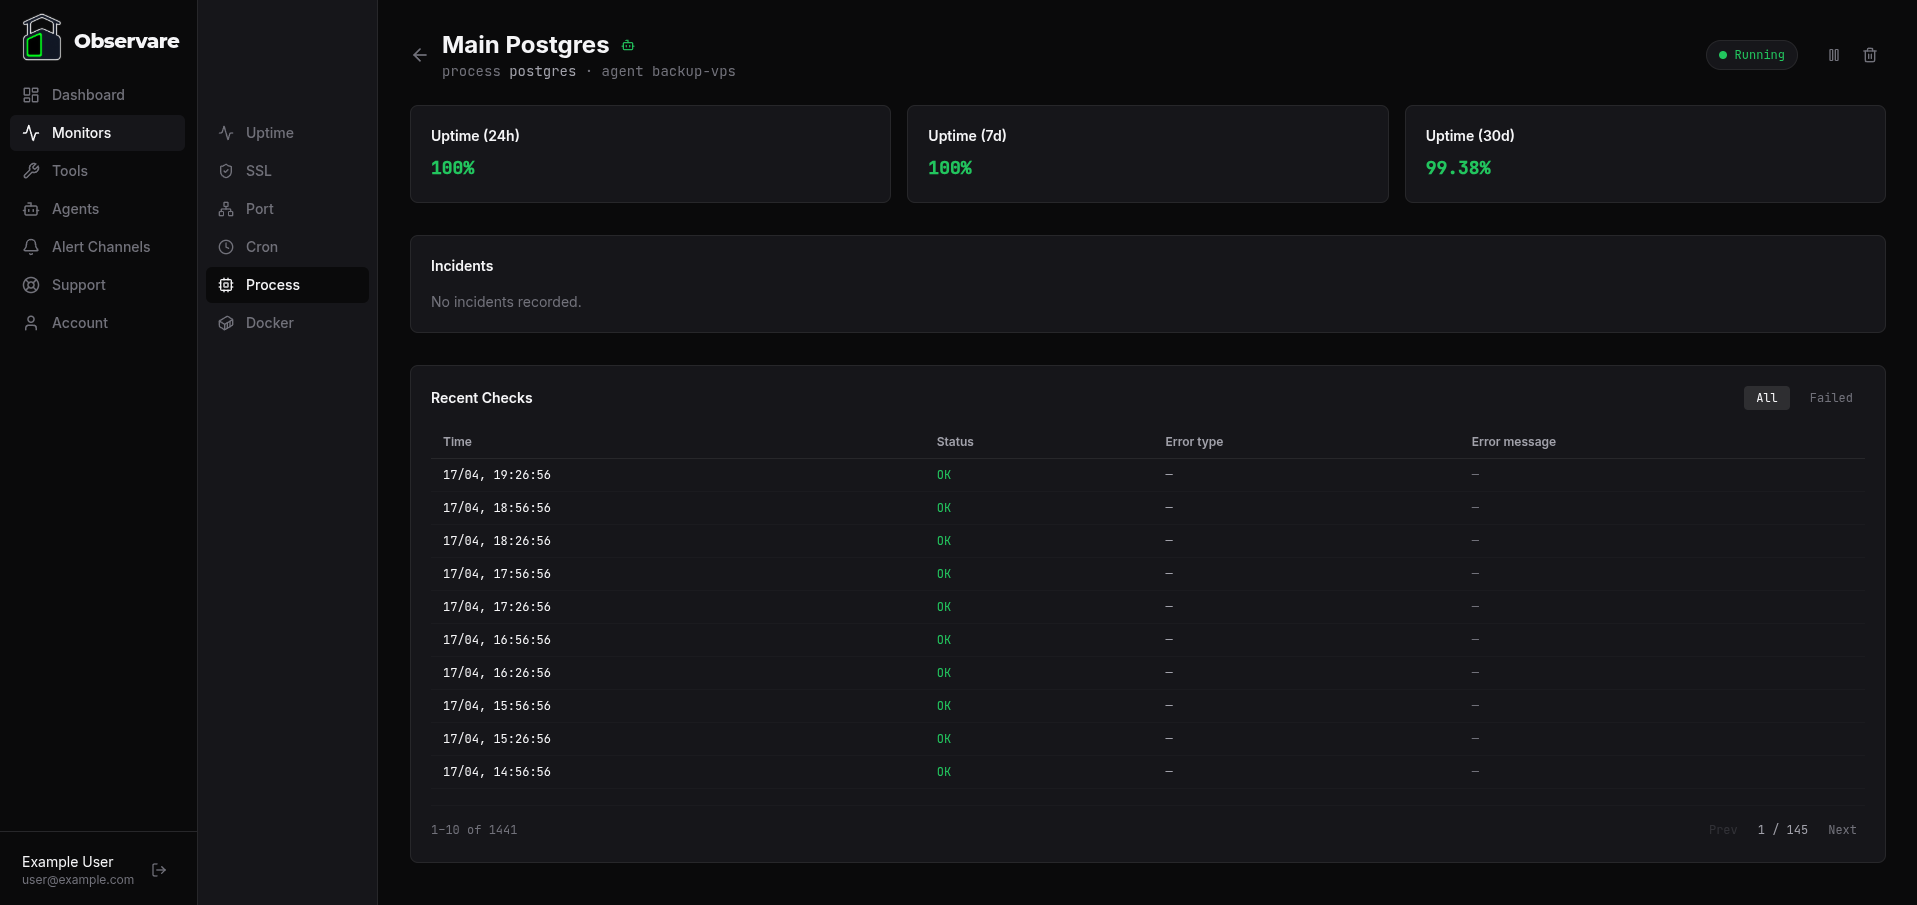
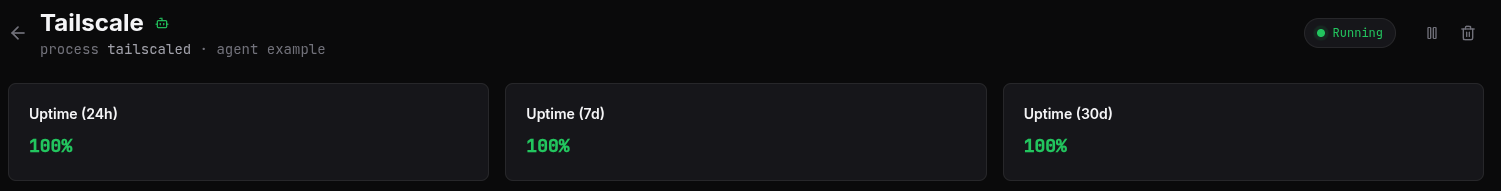
Click any row to open the monitor's detail page, which shows uptime percentages over 24 hours, 7 days, and 30 days, the current incident (if any), and a paginated history of recent checks you can filter to All or Failed.
Editing a monitor
Click the pencil icon on a row to open the edit modal. You can change the name, the check interval, and the alert channels attached to the monitor. You can't change the process name itself — it's the monitor's identity, and changing it would just be the same thing as deleting the old monitor and creating a new one, which should happen from the agent CLI.
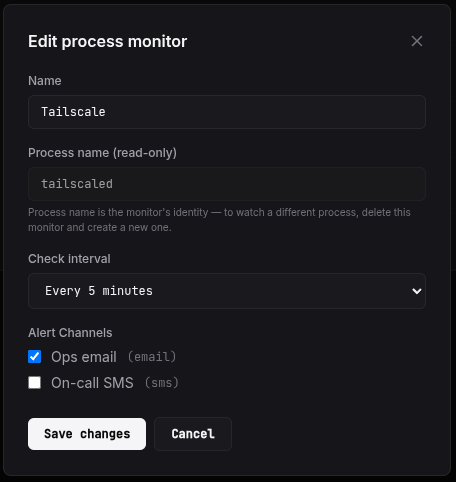
Changes are picked up by the owning agent on its next 30-second config-pull, so the new interval takes effect within 30 seconds.
Failure categories
When a check fails, the failure is classified:
| Error type | When it fires |
|---|---|
not_found |
No process on the host has a matching comm. The common case. |
scan_error |
/proc itself couldn't be read. Shouldn't happen on a healthy kernel — if it does, something is deeply wrong with the host. |
The raw error message is recorded alongside the check row and included in the outgoing alert so you can triage without opening the dashboard.
How a failure is confirmed
The agent doesn't submit the first failed check directly. On any first failure it waits 30 seconds, runs the check again, and only submits the second result. This local recheck catches a process that briefly isn't matching because it's mid-restart or mid-fork, before the alert would have otherwise fired.
That means when the server does see a down result from an agent-executed monitor, it treats the failure as already-confirmed and dispatches the alert immediately — there's no second server-side recheck cycle to wait through.
Incidents and recovery
When a failure is confirmed, Observare opens an incident for the monitor: a record of when the process stopped being detected, when it was seen again, and the total downtime in seconds.
- The monitor's status flips to Not Running.
- A Process Down alert is sent to every alert channel attached to the monitor.
- Subsequent failed checks do not generate new alerts while the monitor is already down.
- When the agent next sees the process again, the incident is closed and a Process Recovery alert is sent with the total duration.
Flapping detection
If a process monitor opens two or more incidents within a rolling 30-minute window, Observare marks the latest one as flapping and sends a Flapping alert instead of another plain down alert.
A flapping process is usually one of three things: a daemon that keeps crashing and being restarted by a supervisor, a script that exits cleanly between scheduled runs, or an interval set too short to account for the process's actual restart time. The flapping alert is your signal to look at the process supervisor's logs or to increase the check interval.
Once the flapping window (30 minutes without a new incident) passes, the monitor returns to normal alert behaviour on the next failure.
Pausing a monitor
Open a process monitor and click Pause. The agent picks up the pause on its next config-pull (within 30 seconds) and stops scanning for the process entirely. The monitor's status changes to Paused and no new check results are recorded. Click Resume to bring it back; the status resets to Pending until the next check lands.
Pausing is useful when you're taking a service offline for maintenance and don't want a 20-minute downtime alert for something you already know about.
Deleting a monitor
Click the trash icon on a row (or on the detail page header) to delete the monitor. A confirmation prompt asks you to confirm — this can't be undone. Deleting also removes every check and every incident the monitor ever recorded. The agent picks up the deletion on its next config-pull and stops scanning.
Account limits
Each account can have up to 30 process monitors. The cap is independent of your uptime, SSL, port, cron, and Docker monitors — 30 process monitors runs alongside 30 of each other type on the same account.
Check history older than 90 days is automatically deleted. Incidents are kept indefinitely.
When to reach for a different monitor type
- The process has an HTTP health endpoint you can hit locally. Use an internal uptime check instead — the status code is a richer signal than "the process is running", since a process can be alive and stuck.
- The process listens on a port you can probe. An internal port check proves the listener is actually accepting connections, not just that the process is resident.
- You're watching a Docker container, not a raw process. Use a Docker monitor — it asks the Docker daemon directly and correctly handles containers that are
exitedvspausedvsdead. - You're watching a scheduled job, not a long-running service. Use a cron heartbeat monitor.
What's next
- Docker monitoring — the same binary "is it running" check for Docker containers.
- Installing the Linux agent — how to get an agent running on a host so you can add process monitors to it.
- Setting up alert channels — make sure down and flapping alerts actually reach you.